County Data
Please cite use of the data on this page as:
Tolbert, Caroline, and Mossberger, Karen, 2020, “U.S. Current Population Survey & American Community Survey Geographic Estimates of Internet Use, 1997-2018.”
The county-level estimates between 1997 and 2012 available here are unique, as county-level estimates were not provided by the U.S. Bureau of the Census until the 2013 American Community Survey. Additionally, we provide estimates of county Internet use for 2013-2018, including estimates for demographic groups within the counties for 2013 and 2014 using American Community Survey data.
Because counties include both rural and urban areas, there are important differences apparent across counties. Rural counties tend to have experienced later growth in broadband at home, and many still lag behind in broadband and mobile. The graphs below show summary figures for the county data. The data and graphs facilitate comparisons across counties, within counties over time, and for rates of change across counties. Maps also show regional patterns as well as overall differences.
Using Summary Tables of the 2013-2014 American Community Survey available in FactFinder, County estimates were created for home Internet access and home broadband by race, ethnicity, education, age, and employment status.
Using microdata from the 2013 American Community Survey, County estimates were developed for home Internet access, home broadband, mobile Internet, and fully connected households broken down by race, ethnicity, education, age, family income, and language skill.
See Codebook here for a more complete description of the datasets, sources of data, survey questions, and methods. CodebookMethodsNSF_BB.pdf
Summary figures (graphs) for counties are available here. These show by county and by overall county averages three-year moving averages, one-year time series estimates, and rates of change for Internet access, broadband at home, mobile use, & fully-connected households. County_Figures.pdf
U.S. County Total Internet Access 2013-14 (user chosen variables for maps) - choices include broadband access and home access for total population, white, black, Latino, Asian, education, age, employed/unemployed
Users can access additional information by rolling the mouse over areas of the map in Tableau. Regional patterns are apparent, with lower rates of Internet use in the Midwest, South, and Southwest, especially in rural areas.
DATA
County Data on Broadband 2000-2018-UPDATED
The spreadheet posted below includes yearly estimates for broadband subscriptions in U.S. counties from 2000-2012 (estimated from the Current Population Survey) and from the American Community Survey for 2013-2018. The CPS data is disaggregated with household weights to create the Internet estimates for 2000, 2001, 2003, 2007, 2009, 2010, 2011, and 2012. The American Community Survey data for counties in 2013-2016 is available for counties with a population of 65,000 or more and they are 1-year estimates. All counties are available in the 5-year estimates for 2017 and 2018 from the American Community Survey.
This County Time Series data set contains the yearly estimates of the percentage of Internet use in U.S. counties along with their populations. The percentage of home Internet access goes back to 1997 from 2014, home broadband to 2000 from 2018, and mobile Internet and fully connected household to 2011 from 2014.
The ACS summary tables from American FactFinder provide the Internet estimates for 2013-2014 and the estimates for the missing years are imputed via linear interpolation.
This County Three Year Average data set takes the three-year moving average of the Internet estimates. The data set contains the yearly estimates of the percentage of Internet use in U.S. counties. The percentage of home Internet access is estimated between 1998 and 2013, and home broadband between 2001 and 2013. Because of the very short time series, three-year moving averages are not estimated for mobile Internet and fully-connected household.
CountyTimeSeriesChangeRate.xls
This County Time Services Change Rate data set is based on CountyTimeSeries.xls, and it estimates the yearly rate of change in the percentage of home Internet access, home broadband, mobile Internet, and fully-connected households in U.S. counties.
CountyThreeYearAverageChangeRate.xls
This County Three Year Average Change Rate data set is based on countyThreeYearAverage.xls, and it estimates the yearly rate of change in the percentage of home Internet access and home broadband in U.S. counties.
CountyYearlySummaryStatistics.xls
This County Yearly Summary Statistics data contains the summary statistics of the percentage of Internet use in counties across years. It summarizes home Internet access, home broadband, mobile Internet, fully connected household for single-year county estimates (countyTimeSeries.xls), and home Internet access and home broadband for three-year moving averages (countyThreeYearAverage.xls).
This County 2013 ACS Fact Finder data set contains the 2013 estimates of the percentage of Internet use in U.S. counties along with their 2013 populations. It is based on the summary tables of 2013 American Community Survey from American FactFinder. For home Internet access and home broadband, the estimates are broken down by race, ethnicity, education, age, and employment status.
This County 2013 ACS Microdata data set contains the 2013 estimates of the percentage of Internet use in U.S. counties. The estimates are generated by disaggregating the 2013 American Community Survey 1-Year Public Use Microdata Sample which was obtained through Minnesota Population Center. For home Internet access, home broadband, mobile Internet, and fully connected household, the estimates are broken down by race, ethnicity, education, age, family income, and language skill.
This County 2014 ACS Fact Finder data set contains the 2014 estimates of the percentage of Internet use in U.S. counties along with their 2014 populations. It is based on the summary tables of 2014 American Community Survey from American FactFinder. For home Internet access and home broadband, the estimates are broken down by race, ethnicity, education, age, and employment status.
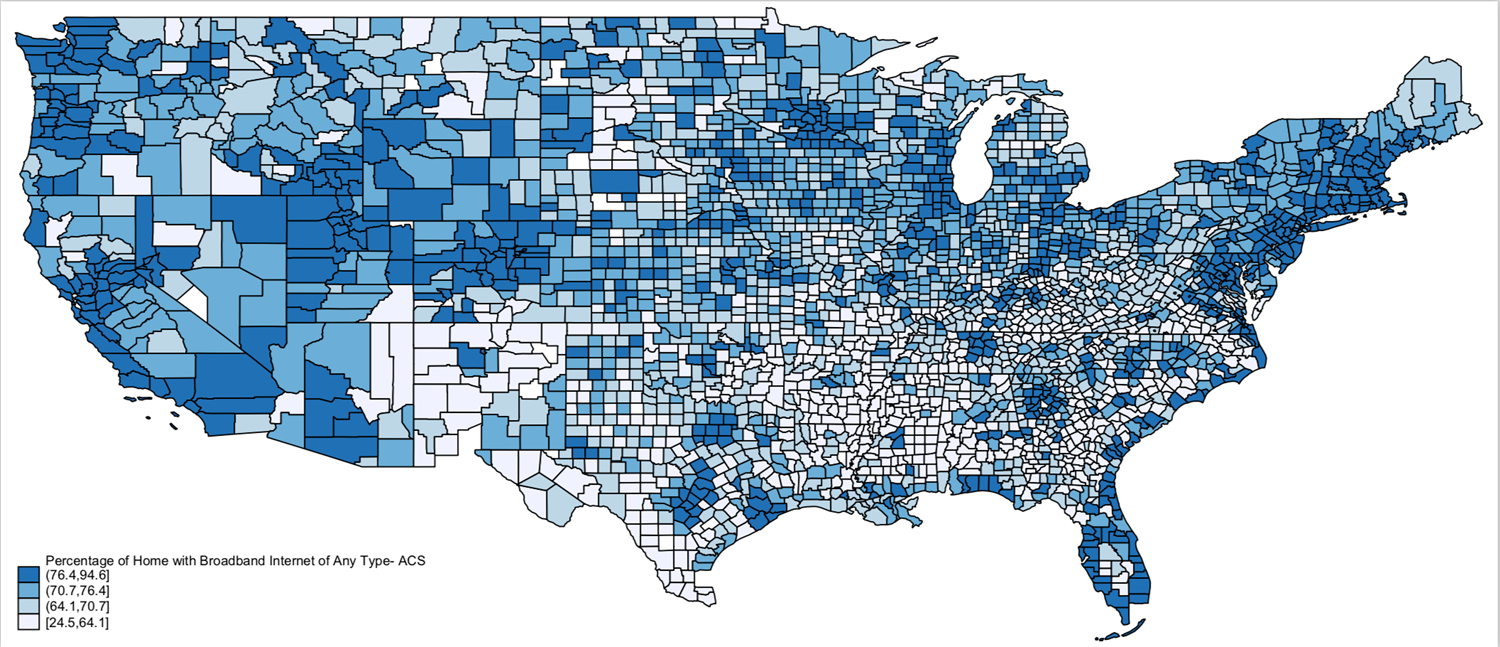
2017 Broadband subscriptions, any type including cell only
(2013-17 averages American Community Survey)
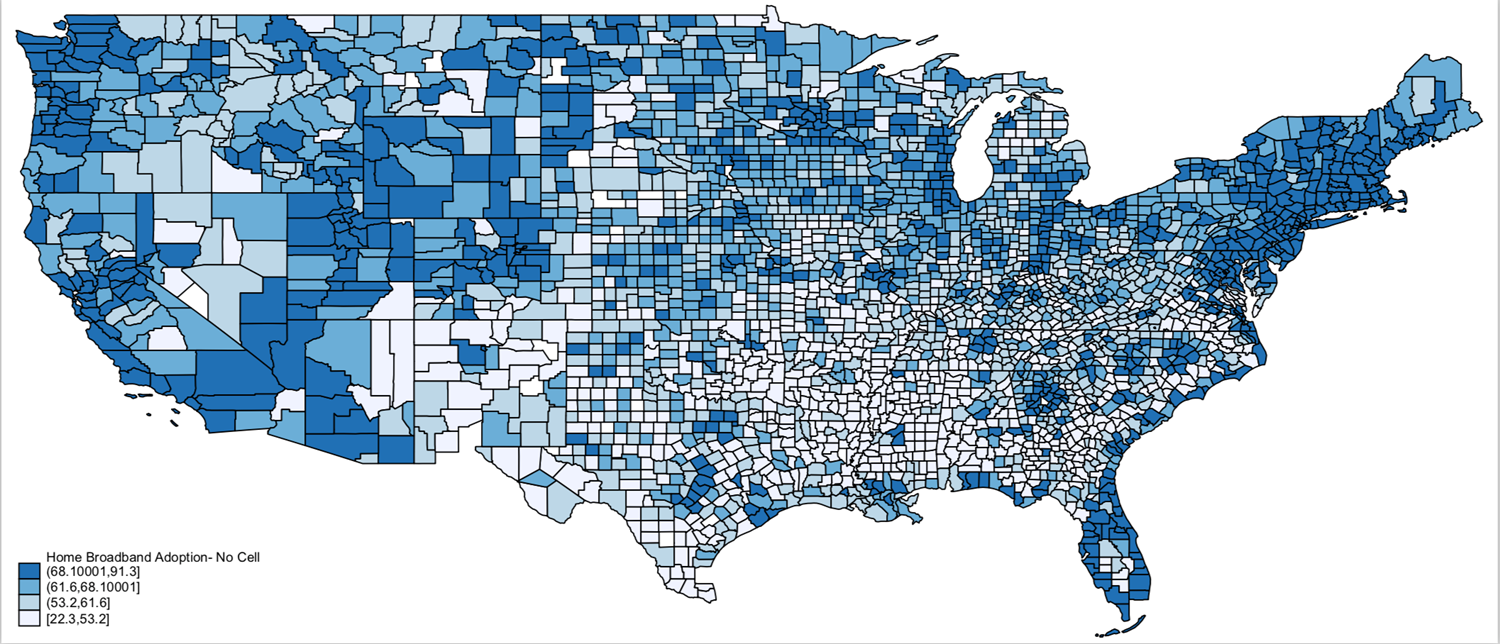
Broadband subscriptions, any type excluding cell only
(2013-2017 averages American Community Survey)
County level interactive Tableau maps of Internet access seen above (2013-2014 ACS) - rollover with mouse in Tableau to see individual data for counties.