Seed Grant Data
This project (NSF 1338471) supported data collection for three “seed grant data” projects posted here to demonstrate new methods for collecting subnational data on internet use.
A) Please cite use of the following data as:
Franko, William W., 2015, "U.S. Current Population Survey 2011: Measuring Activity-Based Internet Use Inequality in U.S. Counties and Metropolitan Areas"
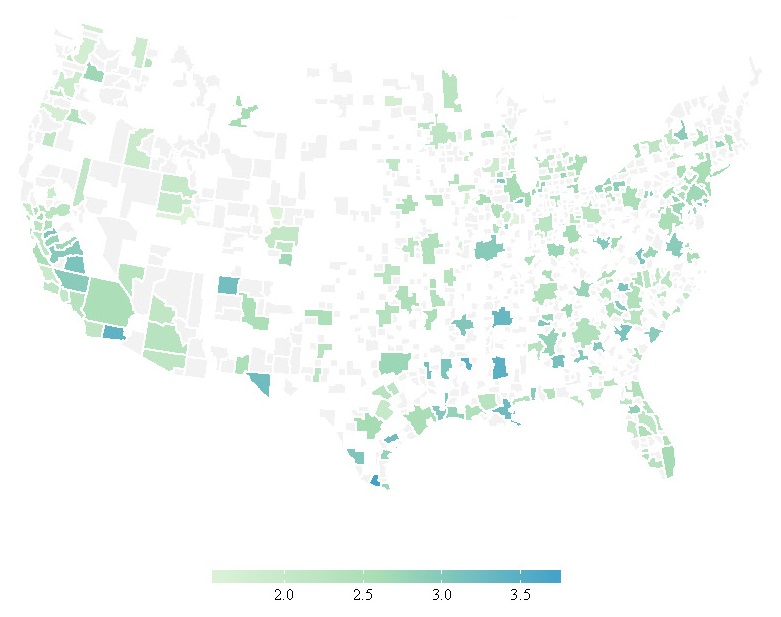
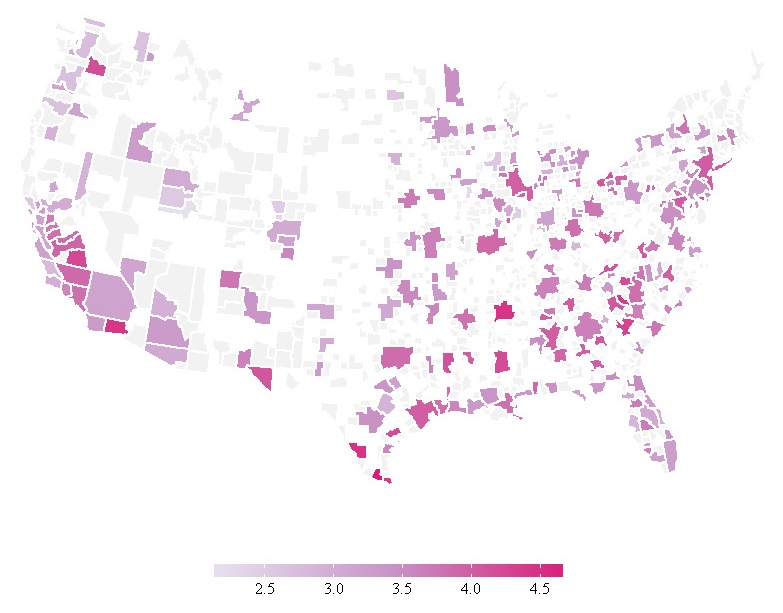
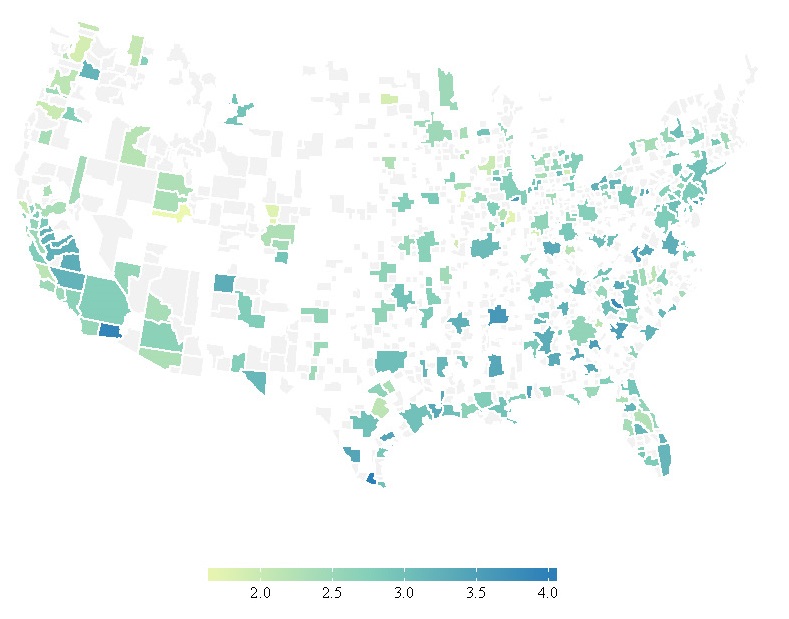
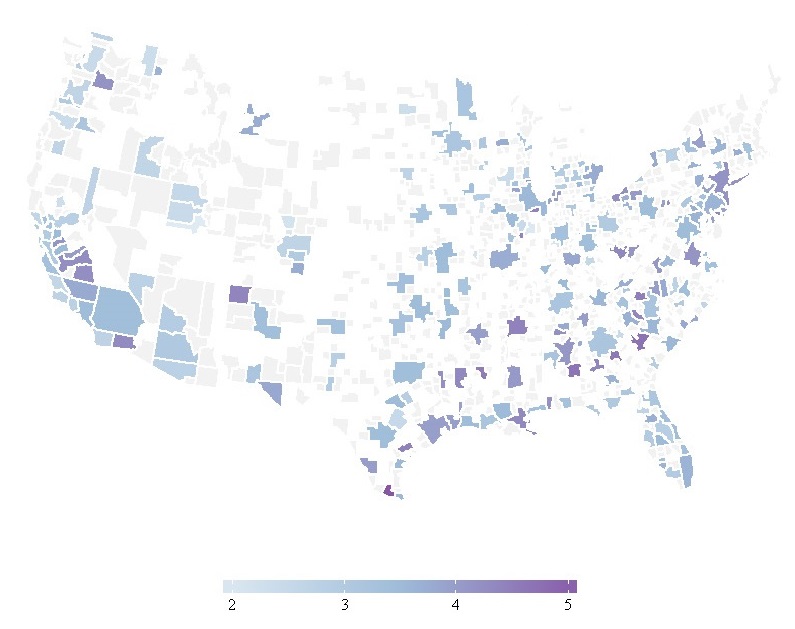
This dataset presents measures of activity-based technology inequality in the U.S. Using recent advances in public opinion estimation, these measures are created using the 2011 Current Population Survey (CPS) Computer and Internet Use supplement. They consist of several aggregate county-level and city-level estimates of online activities across the U.S. Activities online for jobs, government services, health, education, and other uses indicate potential benefits for individuals and communities. Additionally, the ability to engage in a greater number of activities online is in part a measure of capacity to use the Internet.
Measures of disparities in online activities are used to assess the unequal structure of technology adoption and use. The dataset estimates each of the online activities for subsets of respondents according to four income categories, approximating income quartiles in 2011. While the average estimates of online skills provide a useful baseline, the income-based measures allow researchers to more carefully analyze who benefits from the current composition of digital technology use, across communities.
Consider for example two counties where 40% of the public in both areas uses the Internet for communication. When observing the income breakdown of this particular online skill, the poor and rich residents in the first county use the Internet for communication at rates of 30% and 50%, respectively. Yet the income breakdown of the second county reveals that only 10% of poor residents use the Internet for communication and 70% of rich residents do the same. This simple illustration demonstrates how two areas can have similar rates of an online skill on average, but examining how different income groups participate in the same activity can help us understand the structure of technology use.
Multilevel regression and poststratification (MRP) is used here as a measurement strategy that allows for the estimation of county and metro results using national survey data.
Keywords: Current Population Survey (CPS), second level digital divide, Internet activities, geographic variation
U.S. Metro General Information Online Activity Inequality Ratio

U.S. Metro Healthcare Online Activity Inequality Ratio

U.S. Metro Communication Online Activity Inequality Ratio

U.S. Metro Finance Online Activity Inequality Ratio

DATA
Codebook for this internet use inequality data: DigitalActivityIneq-Documentation.pdf
U.S. County level internet activity level inequality data: InternetActivityIneq-CO.xls
U.S. Metropolitan Statistical Area internet activity level inequality data: InternetActivityIneq-MSA.xls
B) Please cite use of the following data as:
McDonald, J. Scott, 2015, "Language as a Barrier to Local Government Access: Spanish Language Access to Local Government Websites"
This data set scores Spanish language access to local and county government websites. Few data exist to support measuring the language accessibility of government websites by persons with limited English proficiency (LEP). The Worldwide Web is asserted as the great leveler, bringing citizens into closer contact with their governments and the services those governments provide. This is certainly the case with English speakers. However for individuals with limited English proficiency, the web has left many behind. The data is organized into two datasets: 1) cities and 2) counties. The city dataset is comprised of the 100 largest U.S. cities for 2012 (http://www.citymayors.com/gratis/uscities_100.html). Counties were sampled on two criteria: a) percentage of population that speaks Spanish or Spanish Creole at home and b) region. To obtain a regional distribution of counties, those with the highest percentages of population that speaks Spanish or Spanish Creole at home were sampled within each of four Census regions: Northeast, Midwest, South, and West.
Keywords: Spanish language, government website access, U.S. local and county
DATA
Codebook for government web Spanish language access: CodebookSpanishGovWebAccess.doc
U.S. local and county Spanish language government web access scoring data:
SpanishGovWebAccess_CityCounty.xls
C) Please cite use of the following data as:
Williams, Christine, 2015, "Understanding Police Social Media Usage Through Posts and Tweets"
This data describes the use of the social media platform Facebook (http://www.facebook.com) by five (5) Massachusetts police departments over a three (3) month period from May 1st through July 31st, 2014. The five (5) police departments represented the towns/cities of Billerica, Burlington, Peabody, Waltham, and Wellesley. In addition to portraying these local trends, they demonstrate a methodology for systematically measuring social media use by government agencies or other organizations. This data was taken directly from Facebook using API’s provided by Facebook. The data includes all “wall posts” made by the representative police departments during this time period and includes data variables such as the text of the posting, the number of “likes” and “shares” (likes/shares represent features available on the Facebook social media platform), information about who performed the “like” or “share”, and comments others made in response to the “wall post”. There are 5 data files, one for each town represented. The number of variables vary per town depending on the post with the maximum number of certain features found in the row (for example, the top number of comments for one police department could be 20 while another could be 30 – the latter dataset would contain 10 more columns per row to account for the maximum possible). The data collected included the time from May 1st, 2014 through July 31st, 2014.
Keywords: local Police, social media use, Facebook wall posts, Massachusetts
DATA
Codebook for MA local police Facebook post data: CodebookPoliceFacebookMassachusetts.doc
Five Massachusetts Local Police Facebook post data: